چهار قدم مهم در رایتینگ تسک یک آکادمیک آیلتس
select & report the main features
اولین قدم نگاه درست به چارت و انتخاب اتفاقات و پیامهای مهم است.
make comparisons where relevant
در مرحله بعد ببینید کدام اطلاعات به یکدیگر ربط دارند و میتوانید آنها را با هم مقایسه کنید.
Write a complete overview
فکر کنید چگونه یک مقایسه کلی بین همه اطلاعات میتوانید انجام دهید که در آن هیچ جزییاتی ذکر نشود.
support your overview
و در آخر به بهترین شکل ممکن آنچه در overview گفتید را با ذکر اعداد و ارقام ساپورت کنید و در جای درست مقایسهها را انجام دهید.
با توجه به توضیحات بالا نمونه پاسخهای رایتینگ تسک یک آکادمیک آیلتس از کتاب کمبریج 18 را که در زیر آمده بخوانید و نکات زیر را بررسی کنید:
- آیا در overview مقایسه کلی انجام شده است؟
- جزییات در overview دیده میشود؟
- به همه main features اشاره شده است؟ به درستی حمایت شدهاند؟
- overview به صورت کامل support شده است؟
- در جای درست مقایسه صورت گرفته است؟
- از چه کلمات و ساختارهای گرامری برای بیان همه موارد بالا استفاده شده است؟
هر چه از این نمونه رایتینگها یاد گرفتید یادداشت برداری کنید و سعی کنید در قالب جمله و یا پاراگراف در رایتینگهای تسک یک آیلتس خود از آنها استفاده کنید.
Cambridge 18, Test1
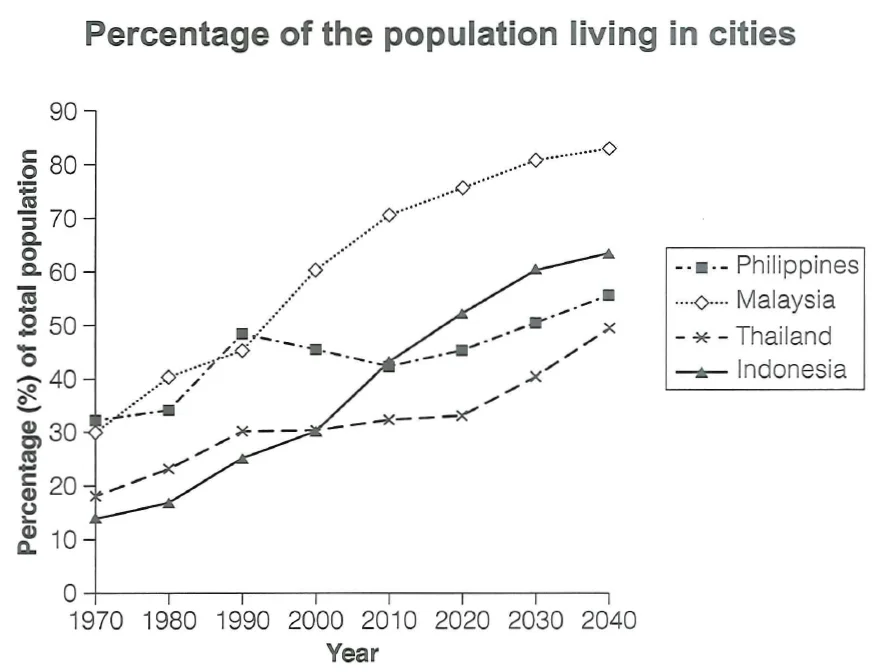
The graph below gives information about the percentage of the population in four Asian countries living in cities from 1970 to 2020, with predictions for 2030 and 2040.
Summarise the information by selecting and reporting the main features, and make comparisons where relevant.
Model Answer:

The line graphs illustrate the proportions of urban citizens in the Philippines, Malaysia, Thailand, and Indonesia between 1970 and 2020, along with their expected populations for the next two decades. Overall, all countries have experienced an overall increase over the years, albeit to varying degrees, and this trend is expected to continue in the future.

Malaysia and Indonesia will witness the highest percentage increase in their urban populations. While 30% of Malaysians lived in cities initially, this figure rose to about 45% in 1990 and then soared to more than 70% in 2020. A similar, albeit slower, trend is foreseen for this country to the end of the period, projecting to peak at approximately 80% in 2040. This pattern is almost mirrored for Indonesia, with merely 15% of its population living in cities in 1970. This rose to 28% in 2000, and then urban population growth accelerated, surpassing Thailand and the Philippines. Indonesia is expected to have the second-highest city population in 2040 at approximately 60%.
The urban population growth in the Philippines and Thailand, on the other hand, is smaller and slower. Although, in 1970, the former had the most populated cities (a little more than 30%), ,except for a 10-year sharp increase and a fall in the two following decades, its urban population increased almost steadily and is predicted to be about 55% by 2040. In Thailand, under 20% lived in cities and this figure has grown since then. However, with a faster growth in the last two decades, by 2040, a little less than half of this county’s population will be living in cities.
Cambridge 18, Test2
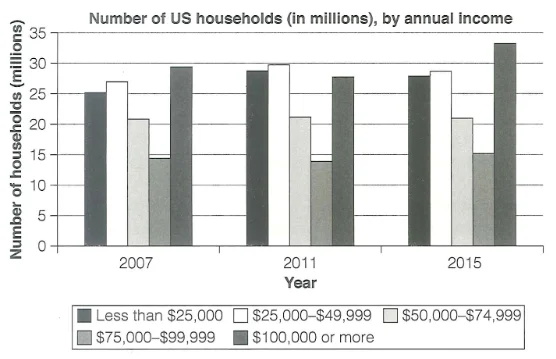
The chart below shows the number of households in the US by their annual income in 2007,2011 and 2015.
Summarise the information by selecting and reporting the main features, and make comparisons where relevant.
Model Answer:
The bar chart illustrates the number of households in the United States categorized by their annual income for the years 2007, 2011, and 2015. Overall, there is a general increase in low and high-income households, while the middle income groups have exhibited no or minimal changes over the eight- year period.
Initially, around 52 million households in aggregate earned less than $50,000 (25 and 27 million), whereas roughly 30 million reached an annual income of $100,000 or more, which constitutes the largest group in 2007. On the contrary, about 35 million fell into the middle income brackets, representing the smallest proportion throughout the given period.
After four years, the two lowest income brackets rose to approximately 28 and 30 million households respectively, representing the largest brackets. By contrast, there was a decrease of around three million in the number of top earners and $75,000-$99,999 bracket in total.
Finally, the top earners significantly grew to approximately 33 million households, marking the highest number among the three years. However, the two lowest income brackets experienced a slight decrease, with figures standing close to each other at about 27 and 28 million. While the figure for the $50,000-$74,999 remained unchanged, that of $75,000-$99,999 category rose to 15 million.
Cambridge 18, Test3
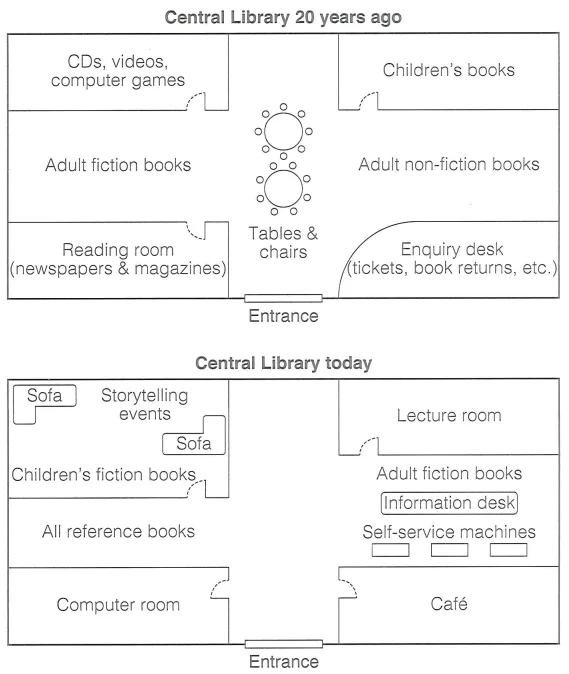
The diagram below shows the floor plan of a library 20 years ago and how it looks now.
Summarise the information by selecting and reporting the main features, and make comparisons where relevant.
Model Answer:
The diagrams illustrate the floor plan of Central Library two decades ago and its current layout. Overall, the library today has turned into a more convenient and modern place for users with a greater focus on the interactive spaces and diverse amenities.
Previously, round tables and chairs were located in the center, flanked by adult fiction and non-fiction sections. In the top corners, there were CDs and videos section on the left and children’s books on the right ,whereas reading room and enquiry desk were situated in the bottom corners.
Today, while the entrance remains unchanged, some features such as children’s and adult fiction sections persist, albeit with some rearrangements. Notably, the room dedicated to CDs and videos has expanded, encompassing storytelling events’ space with some new sofa and children’s fictions books. The tables and chairs in the center are removed and on the left of them reference books are placed. Opposite this, adult fiction books, information desk, and self-service machines have been incorporated, where users can buy tickets, return books, etc. A café now occupies the former enquiry room and a computer room sits in the place of the reading room. Finally, the room for children’s books is used as a Lecture room.