
Cambridge 15, Test1
The chart below shows the result of a survey about people’s coffee and tea buying and drinking habits in five Australian cities.
Summarise the information by selecting and reporting the main features, and make comparisons where relevant.
Model Answer:

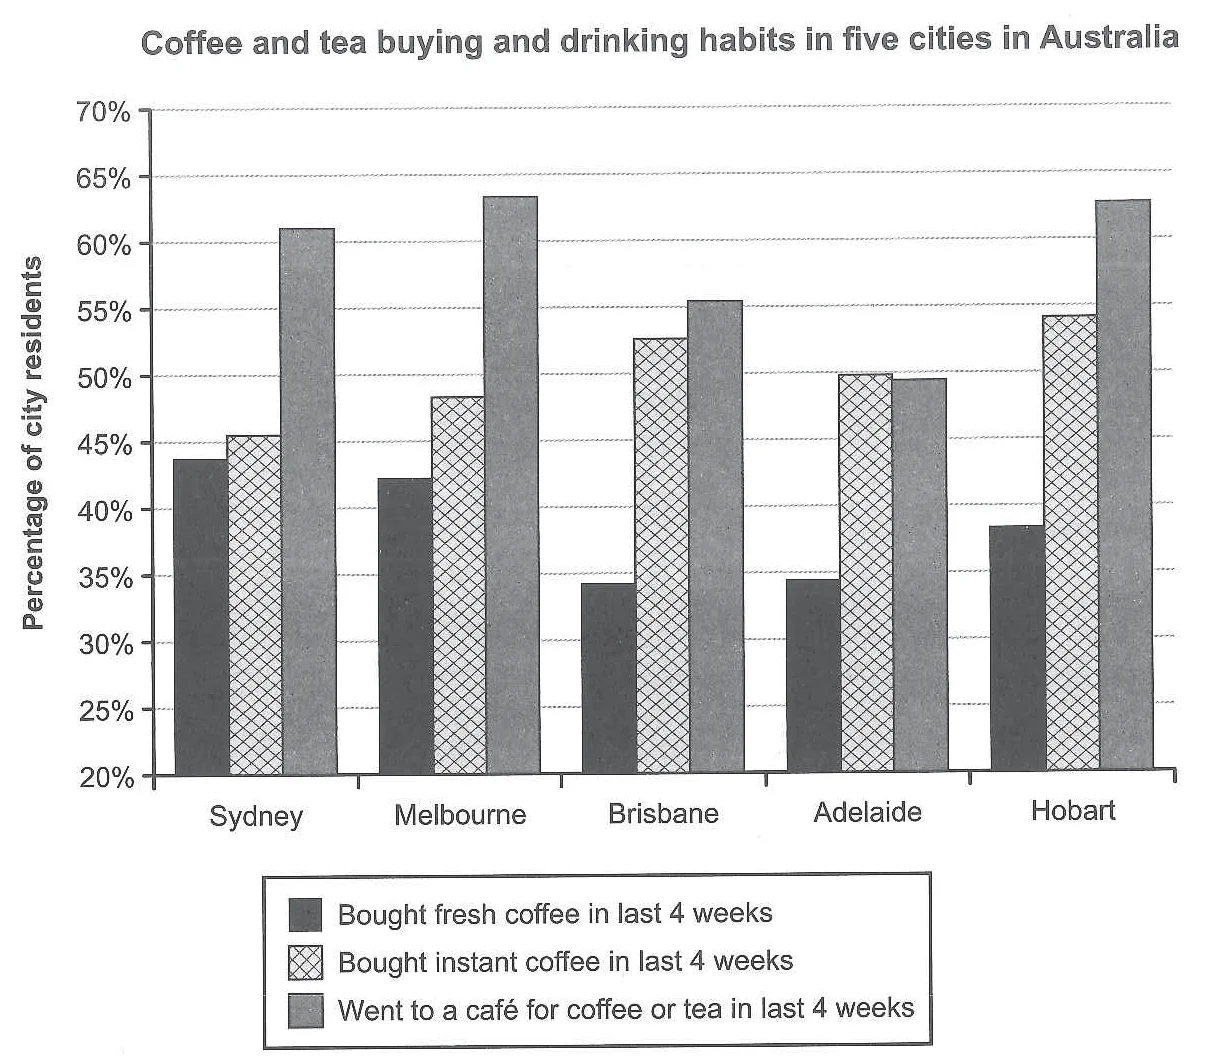
The bar chart, survey results, compares the purchase of coffee and tea and their drinking habits in five cities in Australia in the last four weeks. Overall, while people have gone to a coffee shop for coffee or tea the most in almost all cities, ordering fresh coffee was the least popular habit practiced.

Australian citizens preferred to have coffee or tea in a cafe. Melbourne, Hobart and Sydney top the list with a little over 60%; whereas, Brisbane and Adelaide recorded a lower figure, yet the highest in comparison to other habits, instant and fresh coffee purchase, about 56% and 49% respectively.
Drinking instant coffee generally has been the second most popular habit. Hobart and Brisbane residents practiced it more than other cities (about 54% and 53%), which along with Adelaide showed the minimum difference with going to a café (between 0.5 and 8%). In fact, Adelaideans preferred instant coffee to going to a cafe quite negligibly.
In the last four weeks, fresh coffee was bought the least. People in Sydney (about 44%) and Melbourne (about 43%) ordered this drink more than other cities. By contrast, about a third of people surveyed in Brisbane and Adelaide ordered fresh coffee, which was the least.
Cambridge 15, Test2
The graph below shows the number of tourists visiting a particular Caribbean island between 2010 and 2017.
Summarise the information by selecting and reporting the main features, and make comparisons where relevant.
Model Answer:
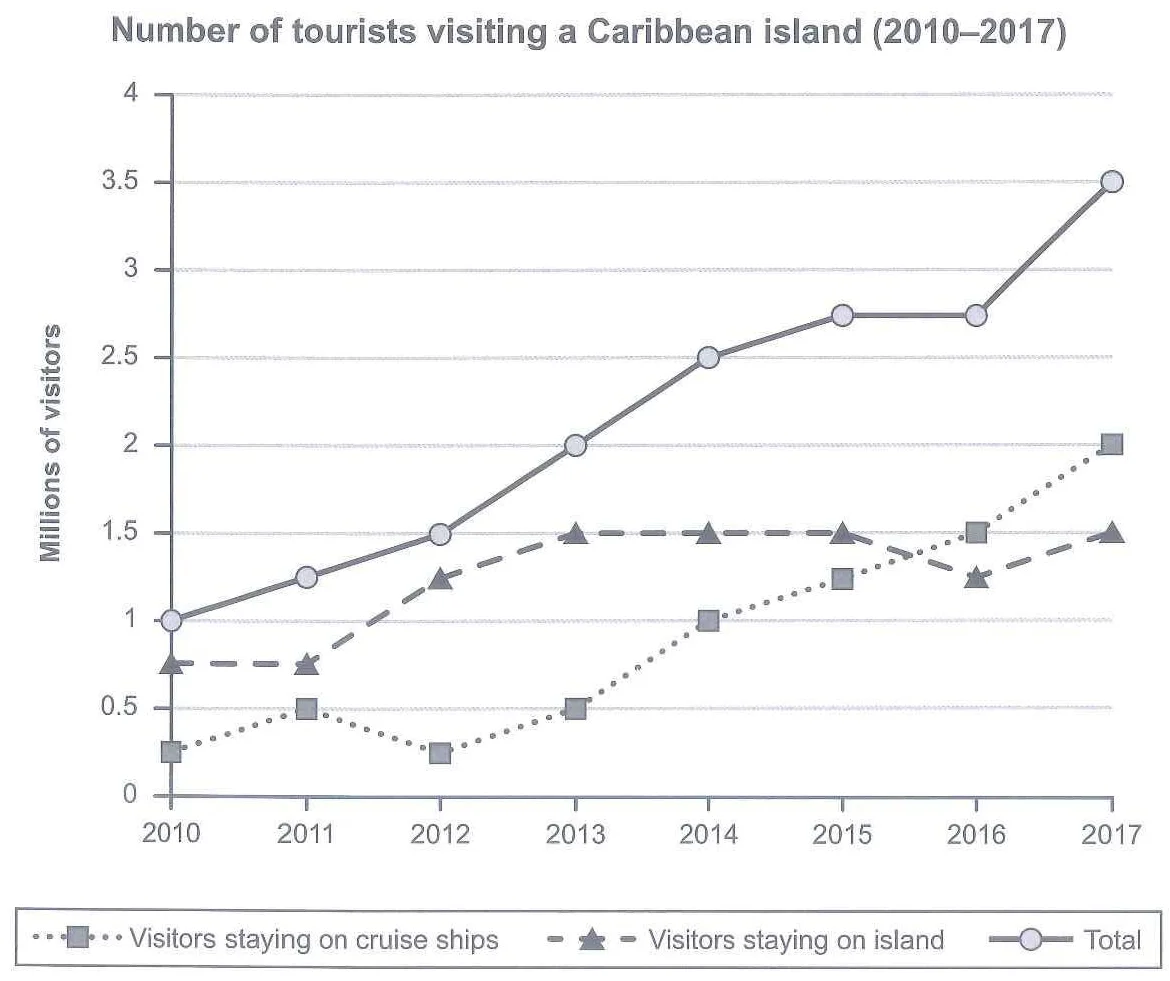
The line graph illustrates the number of visitors to a Caribbean island and where they stayed from 2010 to 2017. Overall, while there has been an increase in the total number of tourists visiting the island, more tourists stayed on cruise ships than the island toward the end of the period.
Those who stayed on cruise ships recorded the minimum numbers in 2010 and 2012 (about 250,000) with a rise and fall in between. However, the trend is constantly rising for the rest of the period which exceeds the figure for island accommodators after 2015. The maximum record is registered in 2017 with two million visitors which is an eight-fold rise from 2010 number.
Accommodating on the island was more preferred in the first five years, starting from about 750,000 to 1.5 million tourists in 2013. However, this number decreased by about a quarter million in 2016 and then rose the same number in 2017, reaching its 2013 figure. Visitors almost doubled in the given period.
The total number of tourists rose significantly from One million to 3.5 million between 2010 and 2017. This rise showed a sharper trend in the last year after a stability from 2015 to 2016, an increase of around 500,000 tourists.